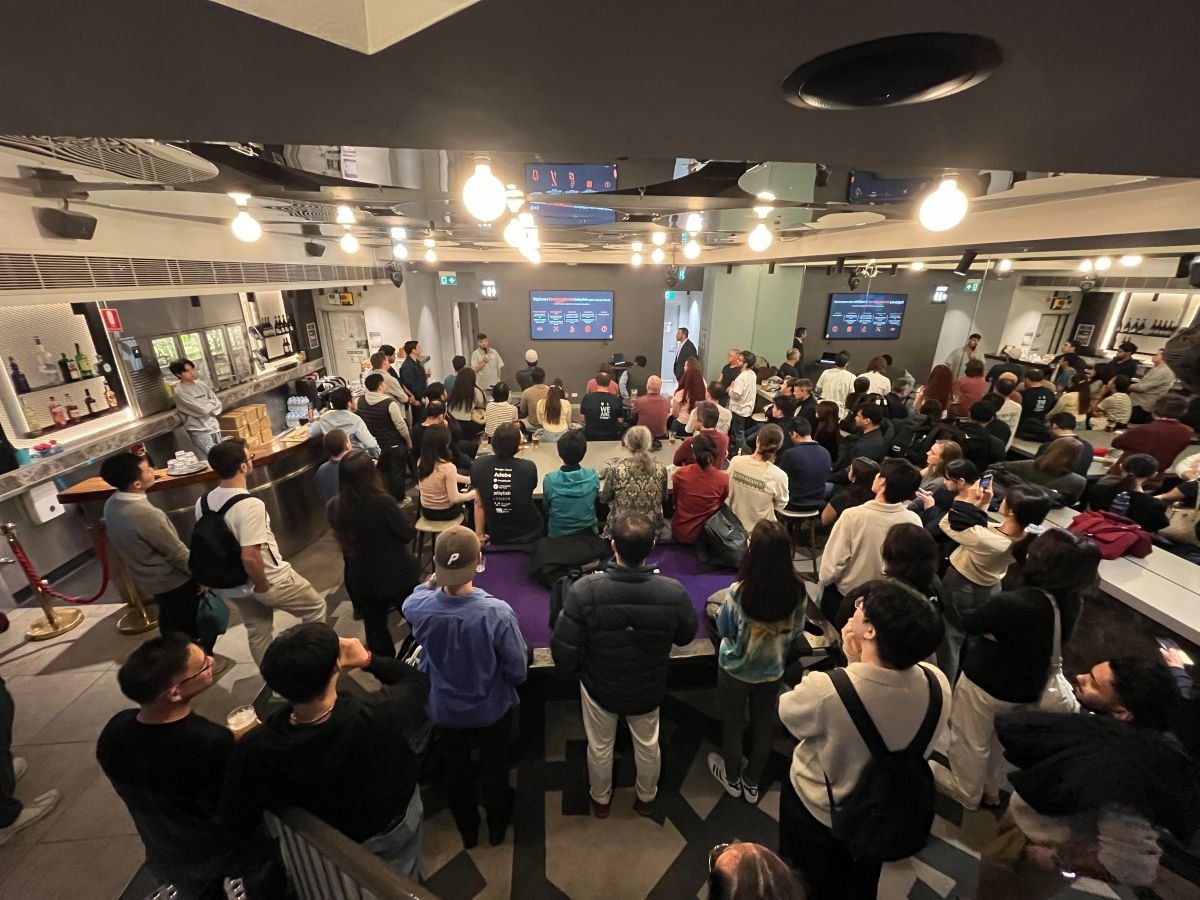
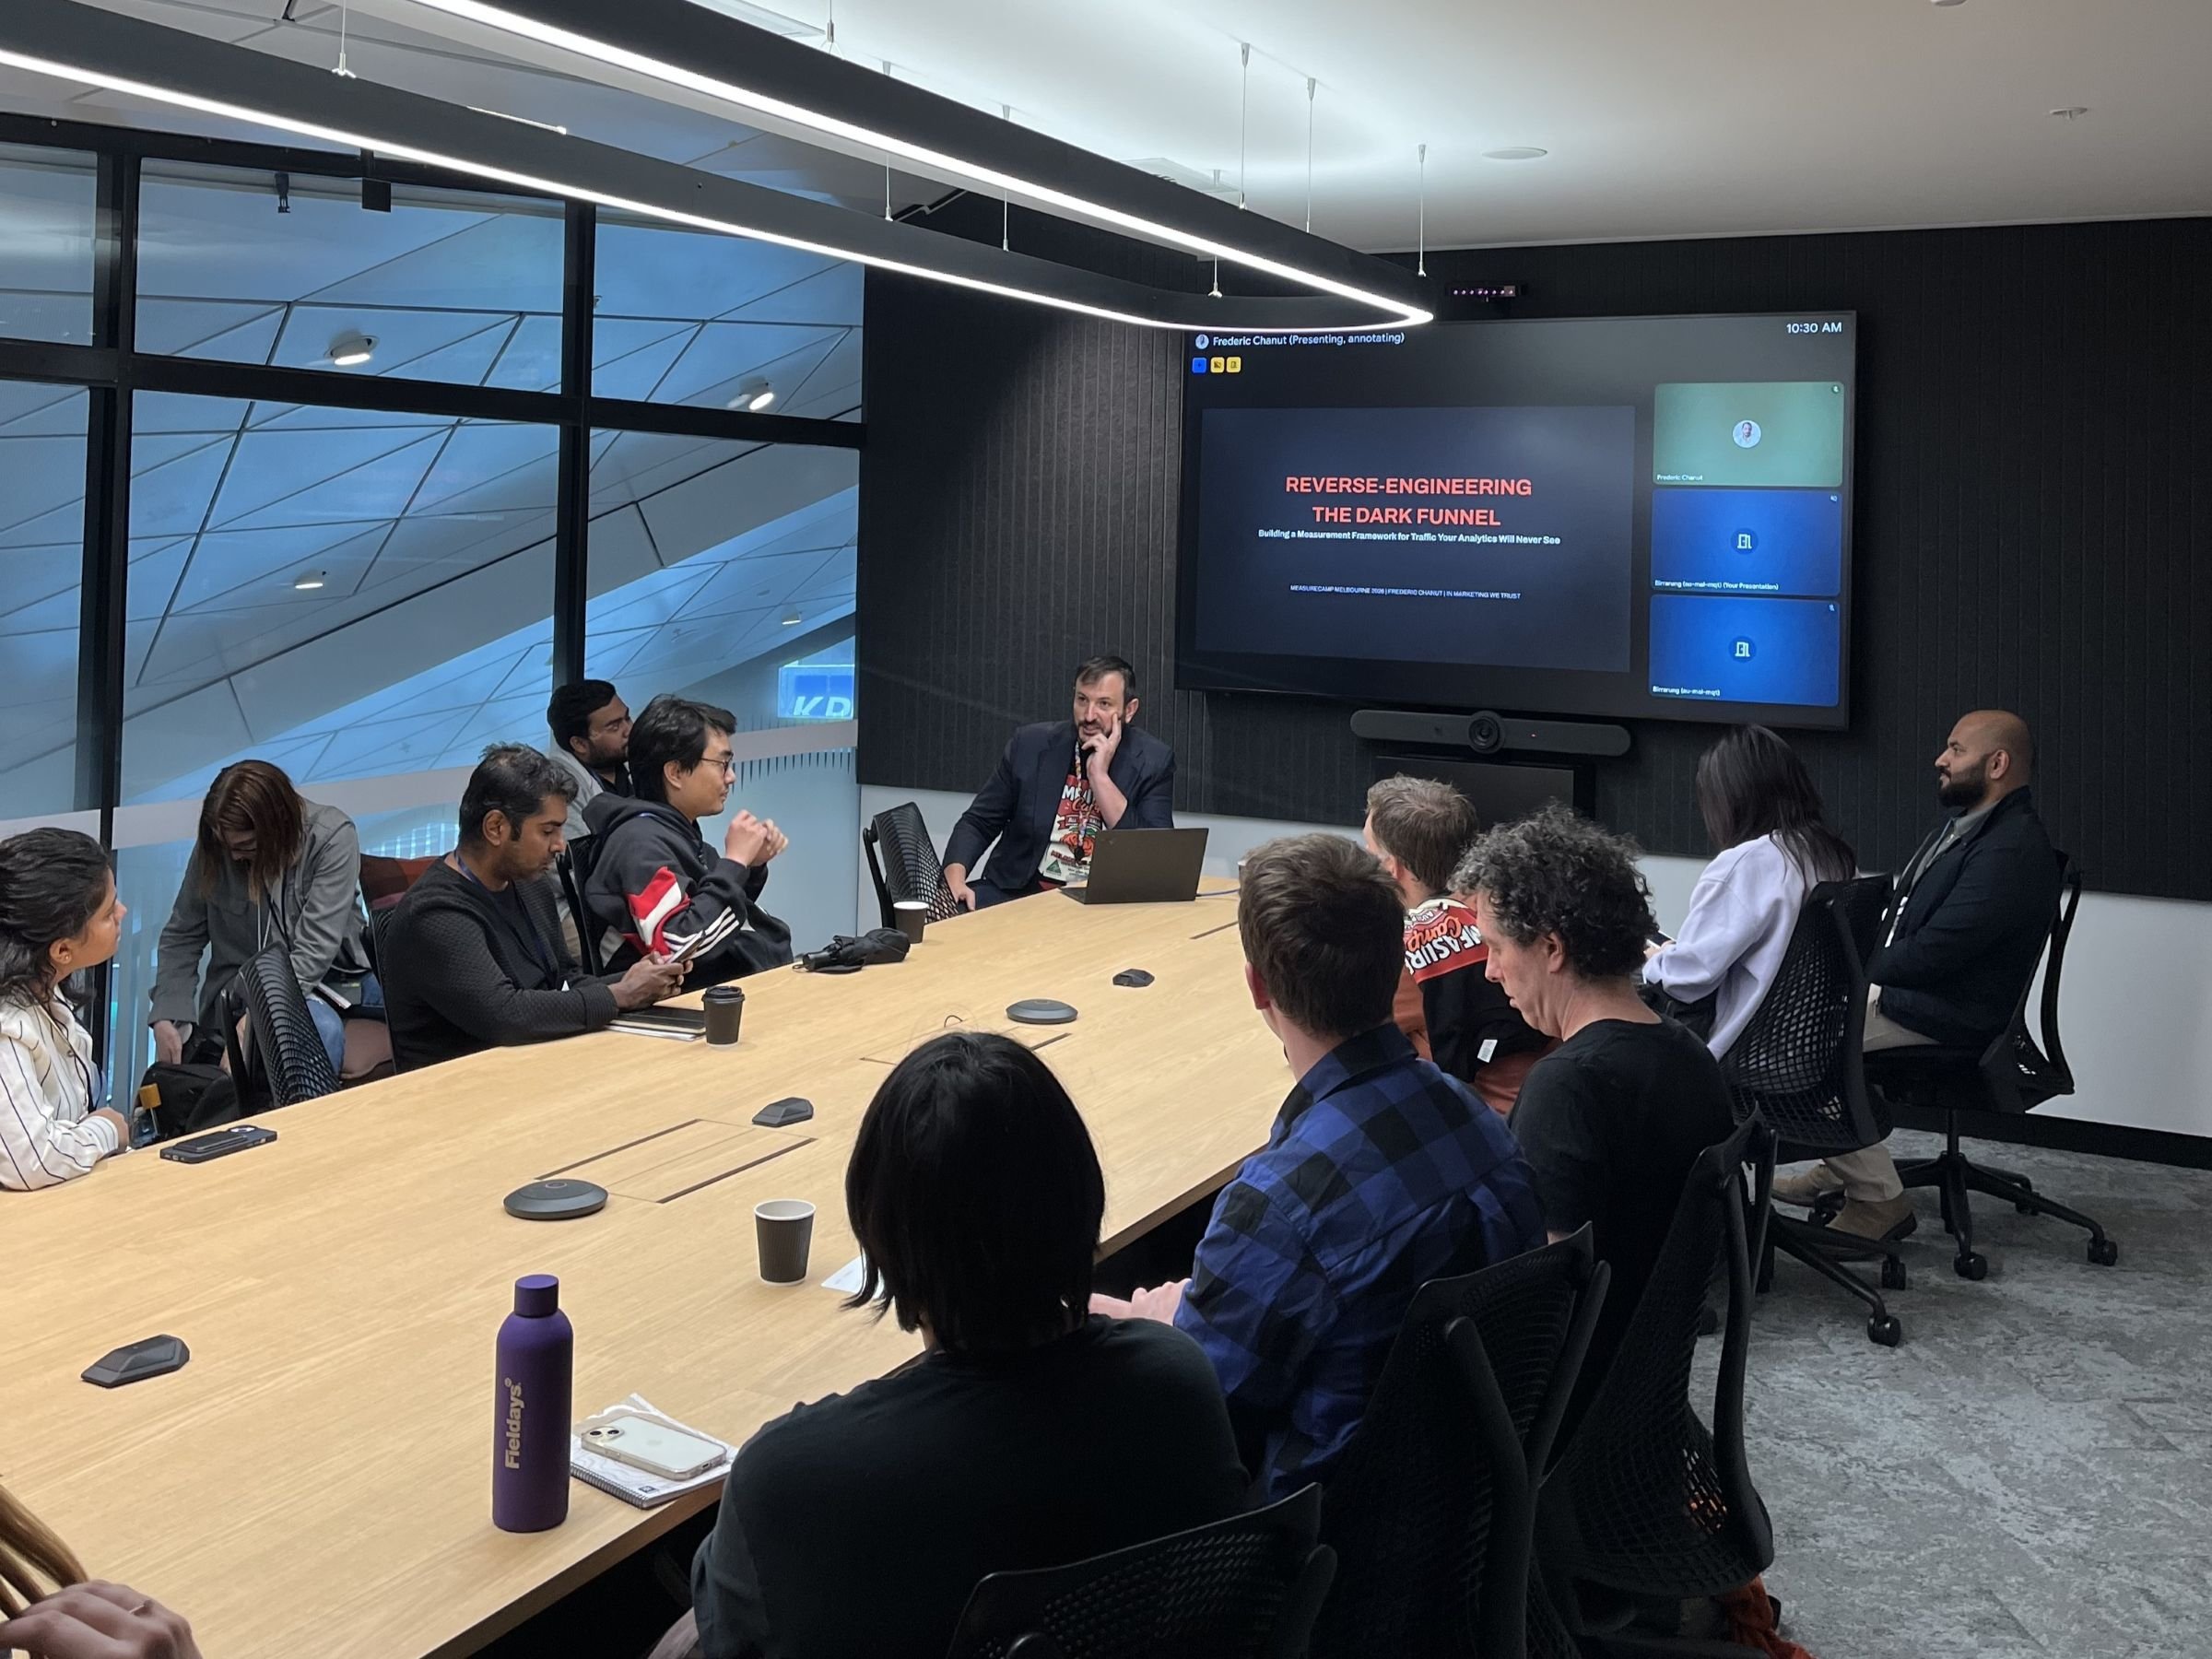
This article expands on a keynote presented at MeasureCamp Melbourne 2026. It details the structural crisis in digital measurement and introduces Discovery360, a framework for mapping customer discovery across fragmented digital surfaces.
The Industry’s Biggest Blind Spot
We analysed 488 conference sessions across 30 global analytics conferences, including MeasureCamp, Superweek, DA Hub, and the Marketing Analytics Summit. We were looking for sessions on the topics that keep enterprise analytics leaders awake at night.
Revenue attribution for AI-driven traffic? Zero sessions. Measuring agentic commerce? Zero. Cross-platform AI discovery tracking? Zero. Quantifying the dark funnel? One.
The analytics industry is having the wrong conversations.
While conferences are packed with sessions on GA4 migration tips, consent mode implementation, and dashboard design, almost nobody is addressing the structural crisis underneath: the majority of your customer discovery now happens in places your analytics was never built to measure. And the data you do collect is increasingly modelled, not observed.
This article lays out the problem in full, explains why the current generation of fixes is necessary but not sufficient, and describes the framework we built to solve it.
The Measurement Blackout: A Reality Check
Ask yourself a simple question: what percentage of your actual website visitors appear in your analytics platform?
Not your modelled users. Not your estimated sessions. The real, observed, consented, attributed human beings who visited your site.
For most sites we audit, the answer sits between 50% and 65%. For B2B and tech companies with strict consent implementations, it drops below 40%. This is true regardless of whether you run GA4, Adobe Analytics, Amplitude, or Matomo. The problem is architectural, not vendor-specific.
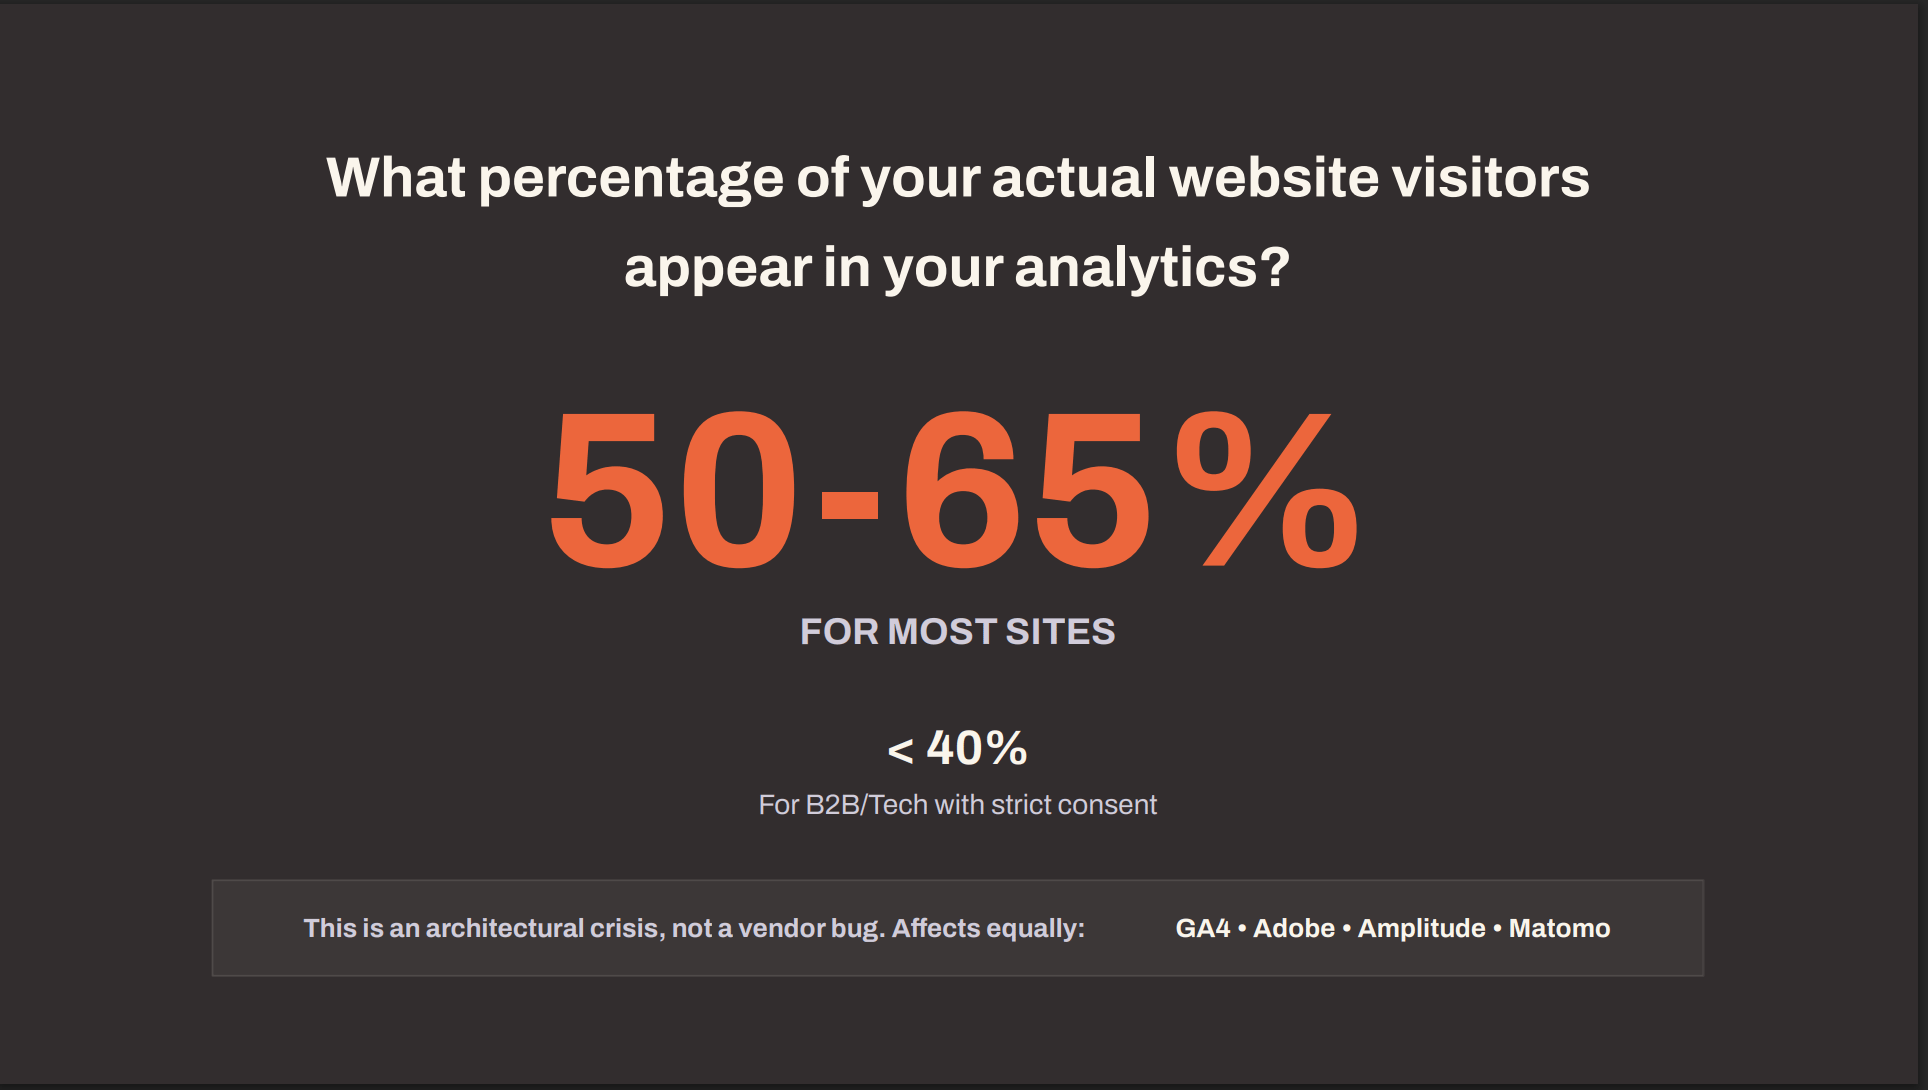
That means you are making business decisions, allocating budgets, and reporting to your board on half the picture. At best.
We call this the Measurement Blackout. And it has been compounding for five years.
The Compounding Clock of Data Loss
This did not happen overnight. Each year since 2021 has added another layer of signal erosion, and the pace is accelerating.
| Year | Event | Impact |
|---|---|---|
| 2021 | Apple iOS 14.5 ATT framework | 96% of users opted out of app tracking |
| 2022 | GA4 replaces Universal Analytics | Loss of keyword data continuity; forced migration disrupted historical baselines |
| 2023 | iOS 17 Link Tracking Protection + Safari ITP | URL parameters stripped; first-party cookie lifetimes reduced to 7 days |
| 2024 | Consent Mode v2 mandatory (EEA) + Chrome Privacy Sandbox abandoned | Modelled data replaces observed data; Google’s own third-party cookie deprecation plan collapses |
| 2025 | AI Overviews on 30%+ of queries; bots exceed 51% of web traffic | Zero-click searches surge; more than half of traffic is non-human |
| 2026 | Australia Privacy Act Tranche 2; OAIC compliance sweeps begin | Ad tech and pixel tracking explicitly targeted by regulators |
For those working in Australia, that last line is not theoretical. The OAIC launched its first-ever compliance sweep in January 2026, explicitly targeting “uses of advertising technology, such as pixel tracking” and “practices that erode information access and privacy rights in AI.” Peter Leonard from ADMA has warned of “substantially higher enforcement risk in relation to many digital marketing practices than had previously been the case.”
Tranche 2 of the Privacy Act reform introduces a right to opt out of direct marketing, stricter consent rules, a mandatory Children’s Online Privacy Code by December 2026, and new automated decision-making transparency requirements. Each of these will reduce the volume of consented, trackable data available to analytics platforms.
The compounding clock is not slowing down. It is speeding up.
Five Parallel Vectors of Signal Loss
The data erosion is not coming from a single source. Five distinct vectors are operating simultaneously, and they overlap in ways that make the true scale of loss difficult to calculate precisely.
Consent refusal is the most visible vector. When a user declines cookies through your Consent Management Platform, your analytics loses that visitor entirely. Depending on geography, industry, and CMP implementation, this removes 15% to 44% of your visitors from your data, according to Cookiebot 2024 consent refusal benchmarks.
Browser privacy features compound the problem. Safari’s Intelligent Tracking Prevention (ITP) and Firefox’s Enhanced Tracking Protection (ETP) reduce first-party cookie lifetimes and strip tracking parameters from URLs. This erodes 20% to 25% of cookie-based identification, even for users who consented. (source: WebKit ITP documentation; Mozilla ETP documentation.)
Ad blockers are now mainstream. GWI’s Q2 2025 data, reported via Backlinko and DataReportal, shows 29.5% of internet users globally run ad blockers. These tools do not just block ads. They block analytics scripts, tag managers, and tracking pixels. Nearly a third of your audience is invisible before consent is even asked.
Referrer stripping is the most insidious vector because it is invisible by design. When a user clicks through from a ChatGPT response, a WhatsApp message, a Slack link, or a privacy-focused browser, the HTTP referrer header is either empty or set to “direct.” There is no technical mechanism to recover this attribution. 100% of traffic from these sources arrives dark.
Bot pollution is the newest and fastest-growing vector. Imperva’s 2025 Bad Bot Report found that 51% of all global web traffic is now automated, the first time bots have outnumbered humans on the web. Your analytics does not reliably distinguish between a human visitor and a sophisticated AI crawler. Every metric you report, from sessions to conversion rates, is contaminated by non-human traffic.
These five vectors do not stack neatly. A single visitor might refuse consent, use an ad blocker, arrive via a stripped referrer, and be indistinguishable from a bot. The overlap makes precise quantification impossible, but the directional conclusion is clear: you are working with a fraction of reality.
“Direct” Is a Lie
If you look at your traffic reports right now, there is a good chance “Direct” is your largest or second-largest channel. For many of our enterprise clients, we see roughly 50% of GA traffic falling into the Direct bucket.
This is not people typing your URL into their browser.
Rand Fishkin shared that SparkToro’s own GA4 shows 95% of their traffic as “Direct.” Finance sites average 72.7%. News sites sit around 68%.
What is actually in that bucket? Traffic from AI chat interfaces like ChatGPT and Perplexity, where referrer headers are stripped or absent. Dark social shares through WhatsApp, Slack, iMessage, and email clients that remove tracking parameters. Privacy browsers that block or spoof referrer data. App-to-web transitions where the in-app browser does not pass attribution. And increasingly, AI agent traffic that arrives with no referrer at all.
Every major analytics platform handles this the same way. If the referrer is missing or unrecognised, the visit goes to “Direct.” It is the junk drawer of analytics. And it is growing faster than any other channel in your reports.
Not Provided 2.0
We are entering an era of “Not Provided 2.0.” When Google introduced AI Mode, it stripped referrer data, creating a new generation of keyword blindness. As Lily Ray noted, “Google does NOT want us having access to traffic data for AI Mode.” Even Google’s John Mueller acknowledged the issue, confirming that AI Mode traffic is grouped with direct traffic.
The growth of “Direct” is not a sign that your brand awareness is improving. It is a sign that your attribution is failing.
Not All Platforms Are Equally Blind
Before moving to solutions, it is worth acknowledging that the degree of exposure to this crisis varies depending on which analytics platform you are running, and for Australian businesses in particular, the platform choice carries regulatory implications that have moved well beyond a technical consideration.
The AU Privacy Act Risk column deserves particular attention. OAIC compliance sweeps in 2026 are explicitly targeting pixel-based tracking, which puts GA4 Free in a more exposed position than many Australian businesses currently appreciate. Matomo’s self-hosted model sidesteps that risk entirely, while GA360 offers some contractual mitigation. This is no longer a purely technical decision; it is a legal and governance one.
The Modelling Illusion
When data goes missing, analytics platforms attempt to fill the gaps with statistical models. Google’s Consent Mode v2, for example, uses machine learning to estimate conversions from users who declined consent.
This sounds helpful. But it introduces a structural problem: the model assumes that users who opt out of tracking behave identically to users who opt in. If privacy-conscious users have different browsing patterns, different purchase intent, or different lifetime value, the model introduces a systemic bias that cannot be corrected from within the platform. (source: Perplexity research synthesis on Consent Mode bias and SGTM race conditions, 2025–2026.)
And there is a scale problem. Consent Mode modelling requires a minimum of 1,000 daily users per consent state to function. Most B2B sites and many mid-market businesses do not meet this threshold. For these organisations, the “modelled” data is not modelled at all. It simply does not exist.
Not all analytics platforms handle this equally. GA4 Free gives you the most constrained version of this problem: thresholded data, opaque modelling, and limited raw data export. GA360 provides unsampled data, full BigQuery access, and higher modelling thresholds. Matomo offers complete data ownership and a first-party architecture that sidesteps many consent issues entirely.
BigQuery exports from GA4 also carry a hidden limitation: they exclude modelled data entirely. If you are running analysis on your BigQuery export and comparing it to your GA4 interface reports, the numbers will not match. The interface includes modelled conversions. The export does not. Most teams do not realise this discrepancy exists.
Even Server-Side Does Not Solve It
Server-Side Google Tag Manager (SGTM) is often positioned as the answer to the data loss problem. It moves tag execution from the user’s browser to a first-party server, bypassing ITP restrictions and some ad blockers.
It helps. But it has hard limits.
SGTM does bypass ITP and ETP by setting first-party cookies from a server context. It does evade some ad blockers by moving tracking requests to a first-party domain. But it does not bypass consent. If a user declines your CMP, SGTM legally cannot track them. The consent requirement is a legal constraint, not a technical one, and no amount of server-side architecture changes that.
SGTM does not recover stripped referrers. If an AI chat interface sends a user to your site with no referrer header, SGTM sees “direct” just like client-side tracking would. The referrer data was never sent. There is nothing to recover.
And SGTM does not reliably filter bots. As Simo Ahava noted at Superweek 2026:
“The main benefits of server-side tagging have very little to do with marginal gains in data quantity.”
There is also a technical subtlety that most implementations miss. SGTM tags fire sequentially, not simultaneously. If event tags fire before the configuration tag loads, those events become orphaned and are attributed to “(not set).” This race condition is a known issue in complex implementations and contributes to data quality problems that are difficult to diagnose.
Server-side tagging is a necessary layer in a modern analytics stack. But treating it as a complete solution to the measurement blackout is a misunderstanding of what it can and cannot do.
MMM: The Rear-View Mirror
Marketing Mix Modelling is experiencing a renaissance. Andy Ford, formerly of Meta’s marketing science team and Coles 360, now at Analytic Partners, is among its most vocal advocates. He describes MMM as the tool that gives marketers a cross-platform view when “platforms and channels don’t talk to each other.”
He is right about the need. But MMM has structural limitations that are often glossed over.
MMM requires a minimum of two years of historical data to build a reliable model. In a market where AI Overviews can shift 20% of search behaviour in months, a model trained on two-year-old data is structurally lagging. The world it describes may no longer exist by the time the model is complete.
MMM operates at the channel level, not the query or moment level. It can tell you that “paid search” drove X% of revenue last quarter. It cannot tell you which specific discovery moments, on which platforms, influenced a particular customer’s decision. For tactical, day-to-day optimisation, it provides no signal.
And there is a data exclusion problem. Complex or messy data sources are often left out of MMM models to keep them tractable. If a channel’s data is too noisy, too incomplete, or too difficult to standardise, it gets excluded. This means the channels most affected by the measurement blackout, the ones with the worst data, are the ones most likely to be invisible to MMM as well.
As Ford himself acknowledges: “You can’t just use measurement to look back and say, I did a good job, well done me. You need to use this to plan forward, to execute better, grow and improve.”
MMM is a valuable tool for retrospective budget allocation. But it is a rear-view mirror. It tells you where you have been, not where your customers are going.
The Traffic Did Not Disappear. It Fragmented.
Here is the critical reframe: the traffic did not vanish. People are still searching, discovering, comparing, and buying. They are doing it in more places than ever before.
The problem is that most of those places are invisible to your analytics.
Discovery has fragmented across at least 12 distinct surfaces. Your analytics platform, regardless of which one you run, reliably measures one of these. Maybe two. The rest is dark.
The 12 Surfaces of Discovery
Google, Bing
YouTube, TikTok
Instagram, LinkedIn, Reddit
Google Maps, Apple Maps
TripAdvisor, Trustpilot
Amazon, eBay
iOS, Google Play
ChatGPT, Gemini, Perplexity
Google AIO, Bing Copilot
AI purchasing agents
Reddit, Quora
Alexa, Google Home, Siri
The Great Decoupling
Kevin Indig, formerly of Shopify and now at Airbnb, documented a pattern in his Growth Memo newsletter that reframes the entire measurement conversation. He calls it “The Great Decoupling.”
His data shows clients where pipeline is growing 2.3 times faster than traffic. One client saw 32% traffic growth alongside 75% signup growth over the same six months. Demos are up double digits month-over-month while organic traffic declines.
His conclusion: “The SEO work didn’t stop working. The measurement broke.”
And: “Traffic was never the point. It was just the easiest thing to measure.”
Eric Stine, CEO of Sitecore, described the same phenomenon from a different angle in Mi3: “Digital marketing is collapsing into a single system where discovery, engagement and conversion happen simultaneously and where the traditional funnel is breaking down.”
In AI-driven discovery, a user asks ChatGPT for a recommendation, gets a shortlist, applies constraints, and makes a decision. All in one session. The awareness, consideration, and conversion stages that defined the traditional funnel happen in a single interaction. Your brand either appears in that initial response or it does not exist in that user’s consideration set.
AIVO Edge, commenting on Indig’s research, added a sharper framing: “It’s not just traffic decoupling from outcomes. It’s visibility decoupling from selection.” Brands show up consistently in early AI responses, then disappear as the conversation progresses and constraints get applied. By the time the user asks for a final recommendation, most of the initial set has been eliminated.
The question is no longer “Were you seen?” It is “Were you chosen?”
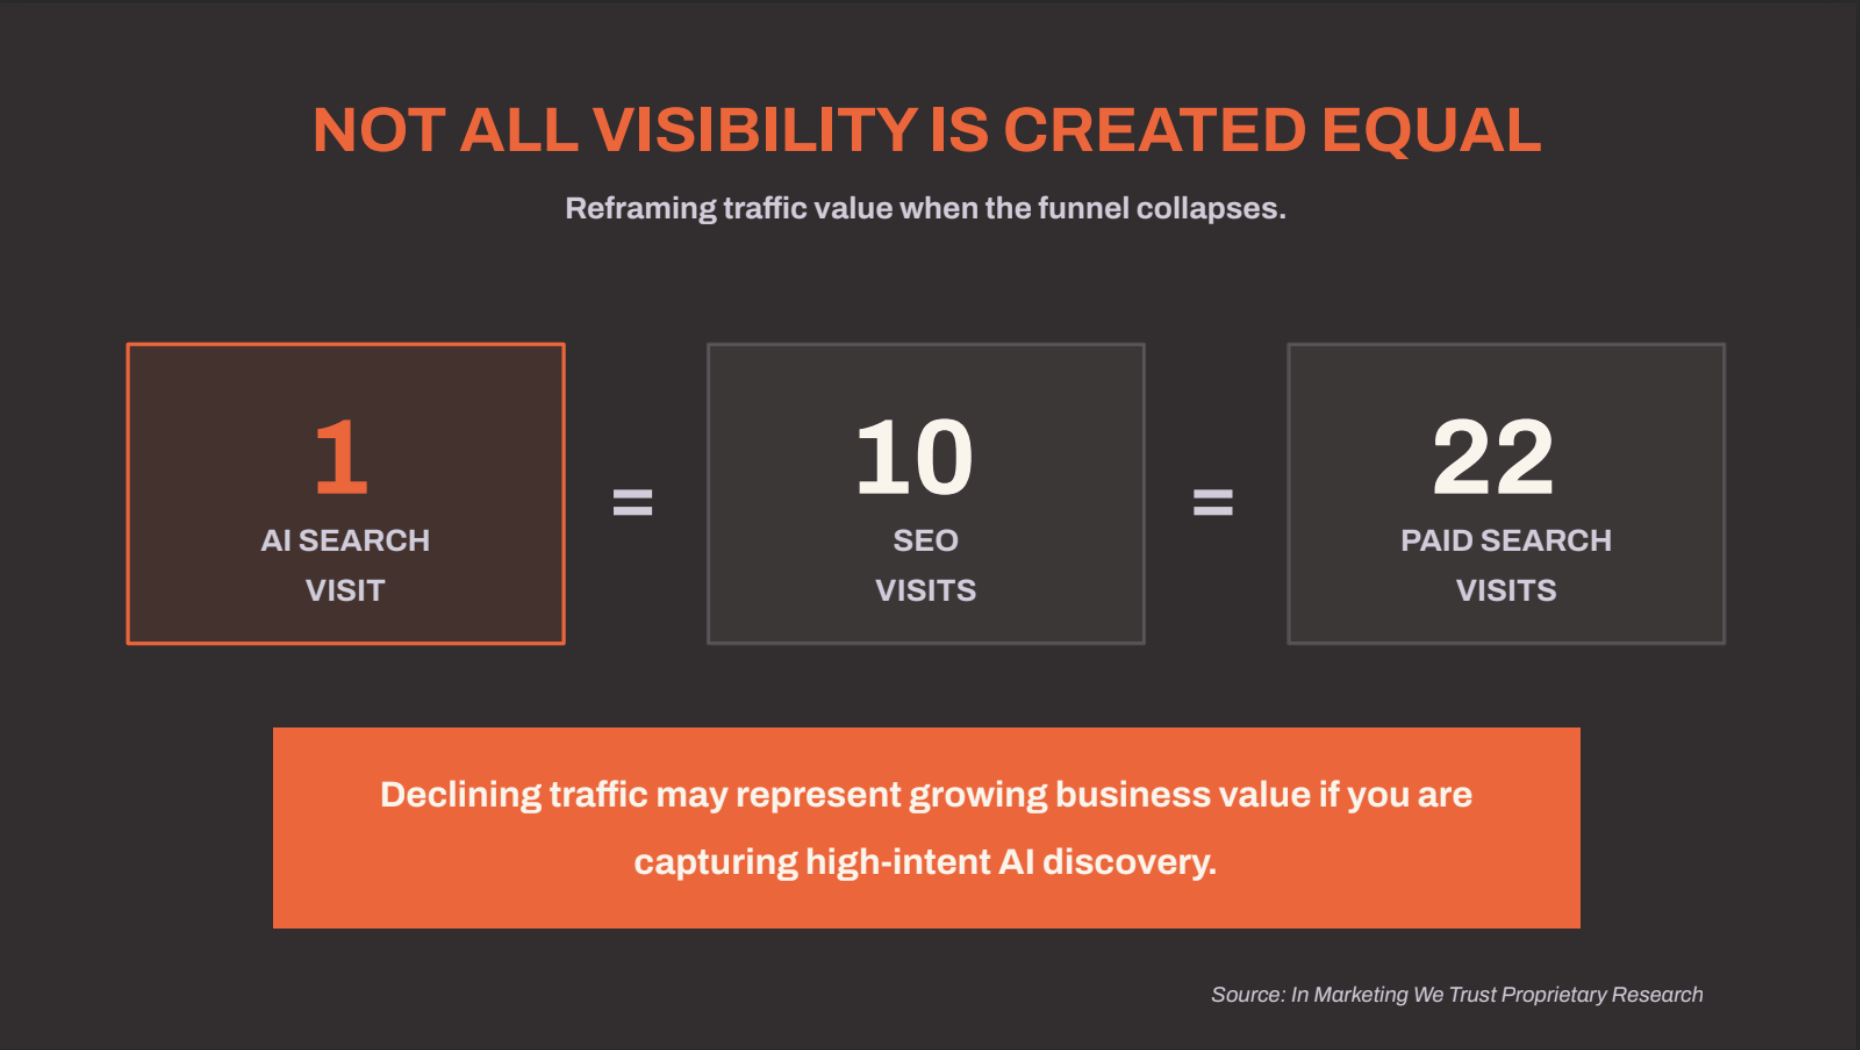
Not All Visibility Is Created Equal
If traffic and business outcomes are decoupling, how do you value what is left?
Our internal research across multiple businesses shows a striking pattern.
Based on conversion intent and downstream revenue per session.
An AI search visit represents a user who has already had their intent synthesised, their options evaluated, and your brand recommended as the definitive answer. By the time they click through, the consideration phase is complete. The conversion intent is an order of magnitude higher than a traditional organic visit.
This reframes the traffic decline narrative. A declining traffic number in GA4 might actually represent growing business value if the composition is shifting toward AI-driven discovery. You cannot see this shift in your analytics. But you can measure it if you build the right framework.
McKinsey estimates that only 16% of brands currently track AI search performance. Gartner predicted a 25% drop in traditional search engine volume by 2026. And research suggests AI-referred visitors convert at four times the rate of traditional search visitors.
The value equation has shifted. If you are still measuring success by traffic volume, you are measuring the wrong thing.
The Problem We Set Out to Solve
Given everything above, we faced a question that could not be answered with existing tools.
How do you build a discovery and measurement strategy when your data is missing, modelled, or actively misleading you? How do you make decisions about channels you cannot see, on platforms that do not give you data, for audiences whose journeys never touch your website?
This is the problem Discovery360 was built to solve.
Discovery360: The Architecture
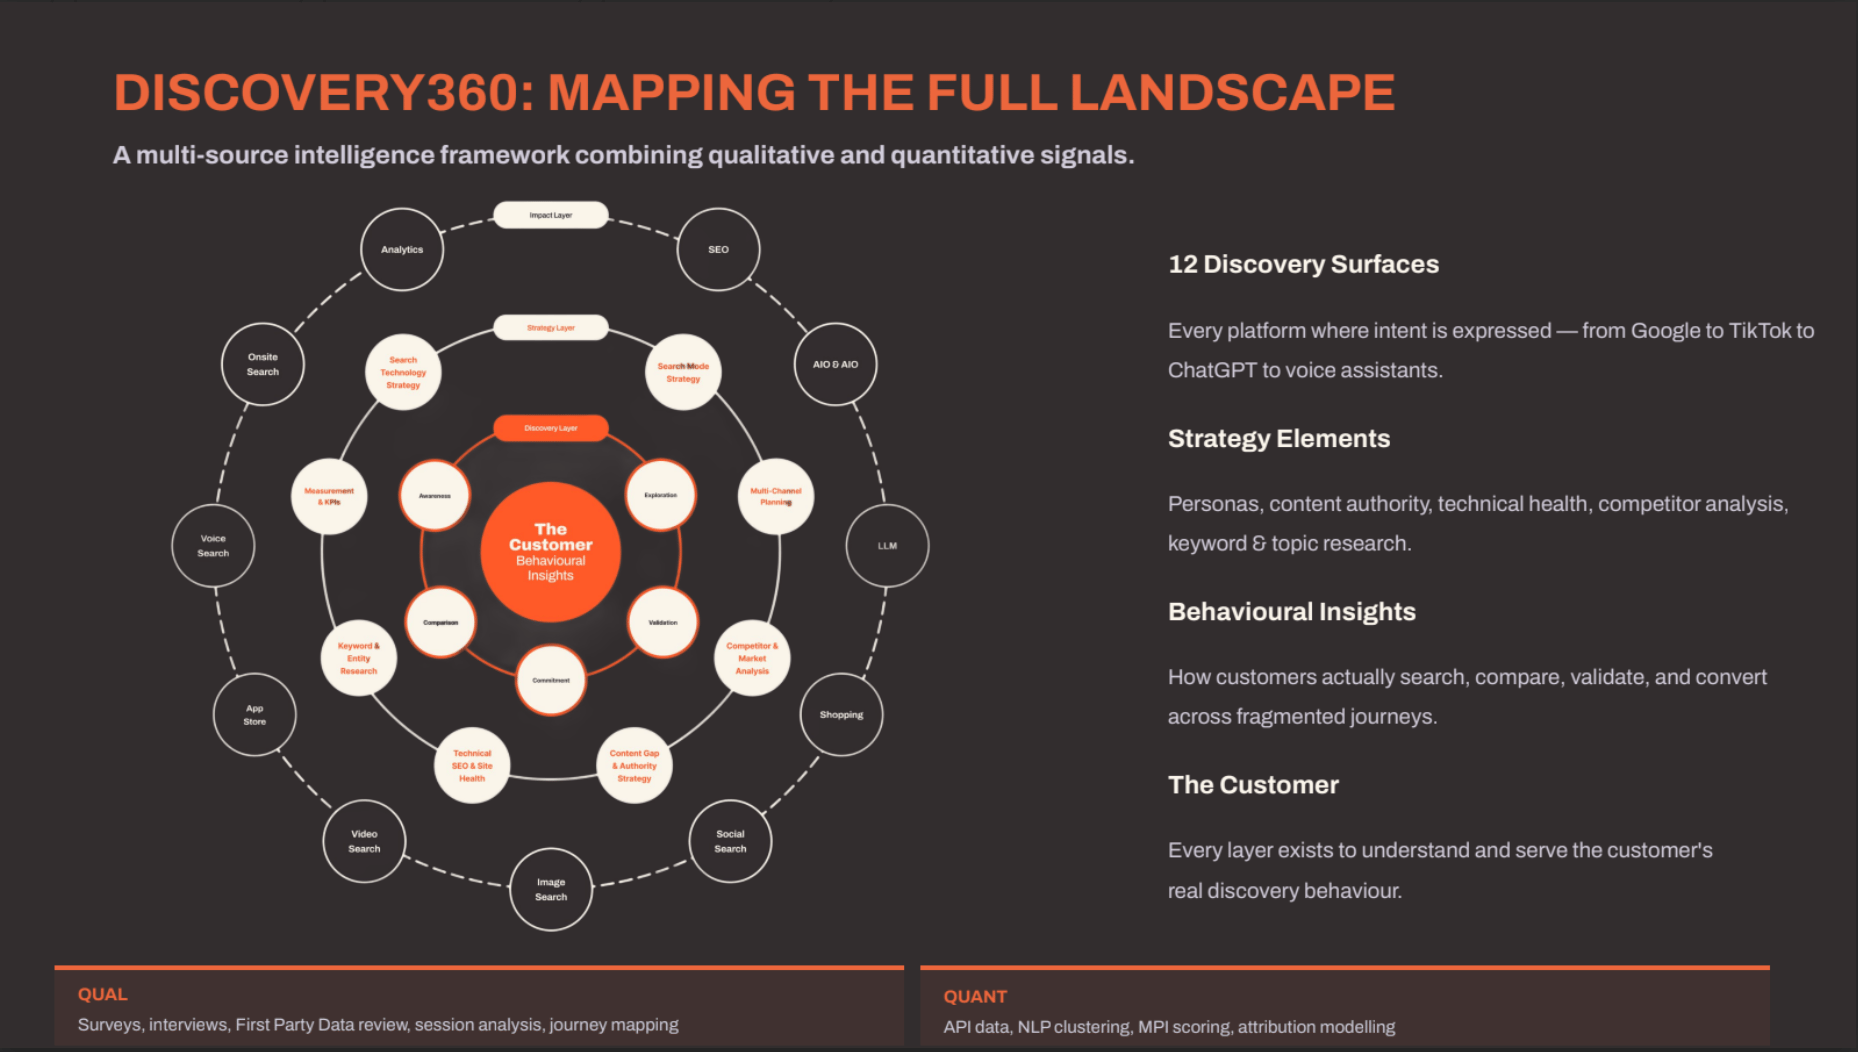
Discovery360 is a structured methodology for mapping the reality your analytics cannot see. It combines qualitative research with quantitative data across all 12 discovery surfaces to reconstruct the dark funnel.
The architecture works in concentric rings.
At the centre is the customer. Not a cookie ID. Not a device fingerprint. The actual human being whose behaviour you are trying to understand.
Around the customer sits a layer of behavioural insights, built from qualitative research sources like GWI, Roy Morgan Helix (for Australian psychographic data), and primary surveys. These map intent, motivations, and platform preferences across the entire discovery journey.
The next ring contains strategy elements: search technology strategy, multi-channel strategy, content gap analysis, competitor and market analysis, and technical foundations. These translate behavioural understanding into strategic direction.
The outer ring maps the 12 discovery surfaces where your audience actually finds you. For each surface, we collect both quantitative data (search volumes, impression counts, engagement metrics) and qualitative signals (sentiment, brand mentions, recommendation frequency).
The Moment Priority Index: Replacing Gut Feel with Scored Priorities
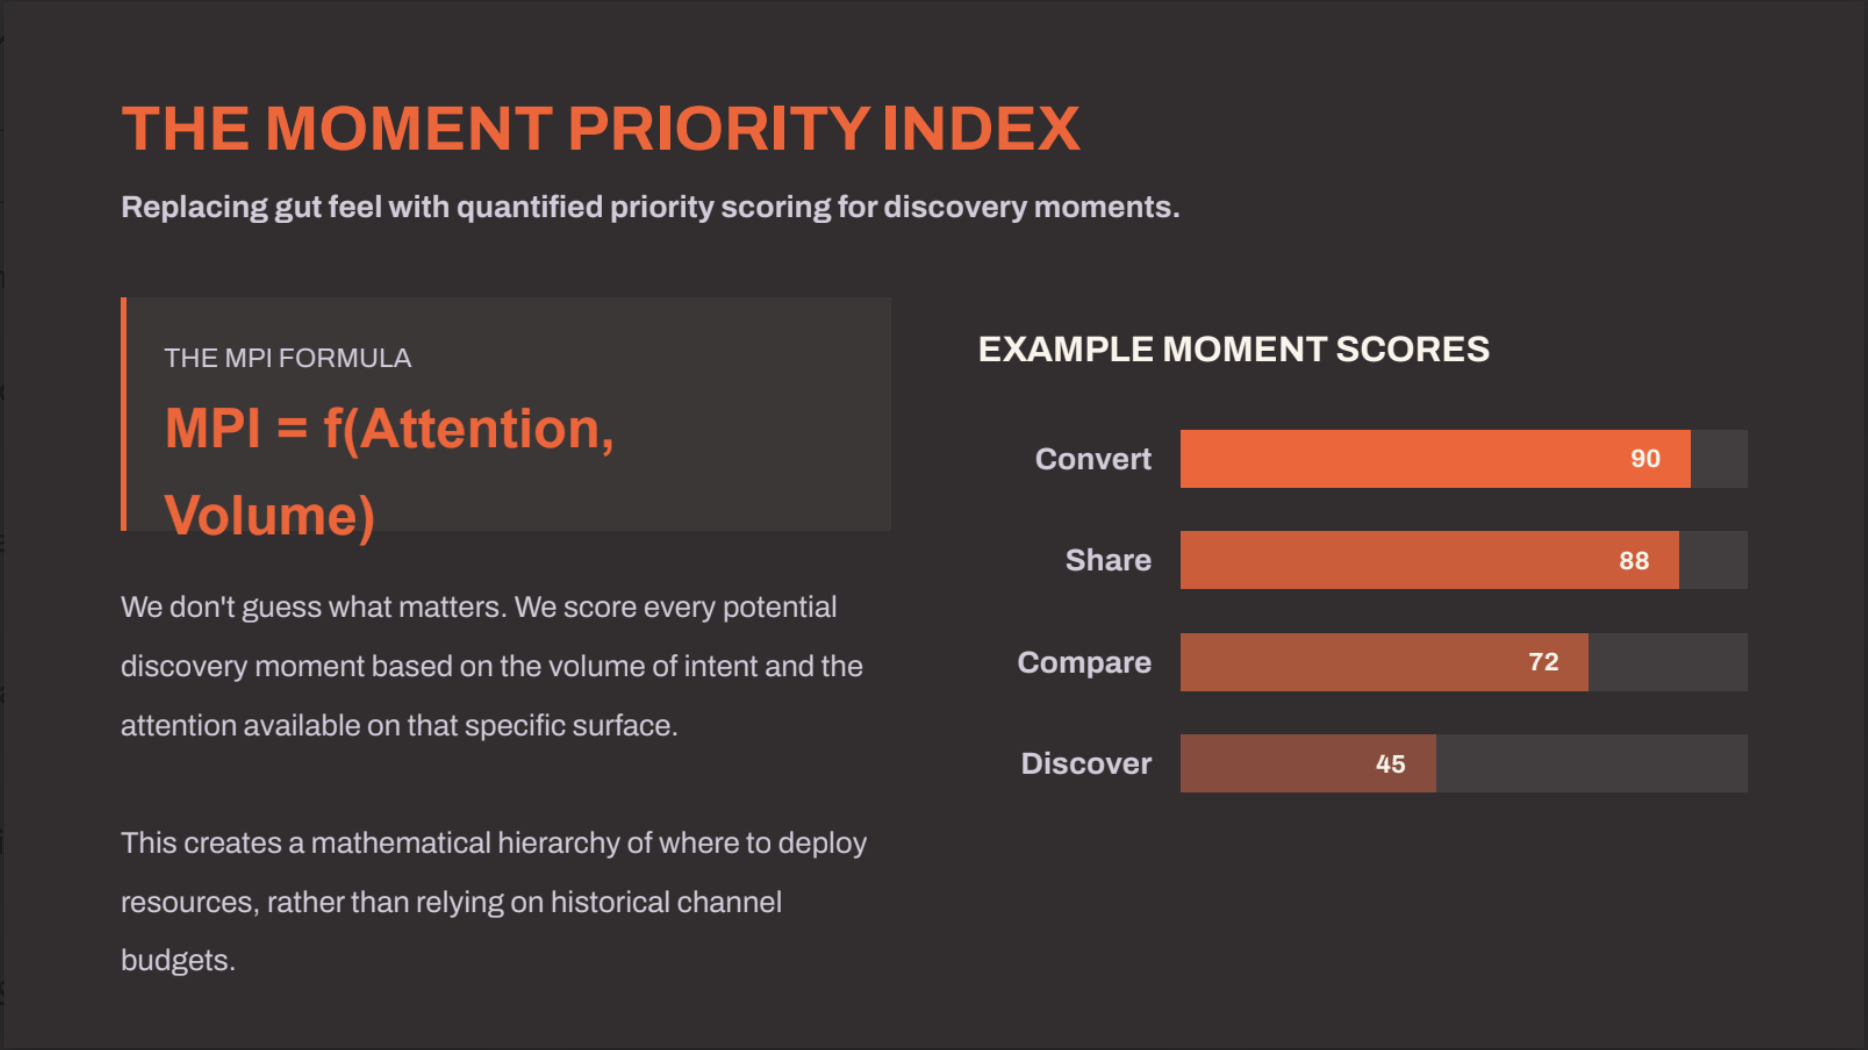
At the heart of Discovery360 is the Moment Priority Index (MPI), a scoring function that quantifies the strategic value of every potential discovery moment.
MPI is a function of Attention and Volume. For each moment in the customer journey, we score how much focused attention the customer gives that stage, how frequently it occurs across your audience, and how close it is to a commercial decision.
The output is a numerical score from 0 to 100 that creates a mathematical hierarchy for resource deployment. Instead of allocating budget based on historical channel performance or gut feel, MPI tells you exactly which moments deserve the most investment.
A “Convert” moment might score 90, meaning high attention, high frequency, and high commercial proximity. A “Share” moment might score 88. A “Discover” moment might score 45. This is not a subjective ranking. It is a quantified priority based on real audience data.
The MPI approach is analogous to the attention mechanism in transformer models: it identifies where the most “attention weight” should be allocated across the entire discovery space.
| Stage | MPI Score | Why It Matters |
|---|---|---|
| Validate | 90 | High-intent consumers seek proof. UGC and reviews here directly feed AI citations. |
| Share | 88 | Post-trip advocates loop into discovery for future audiences via LLMs. |
| Compare | 85 | Competitive pressure is highest. Clear differentiation drives preference. |
| Book | 80 | Intent peaks, but volume is lower. Convert hard-won demand. |
| Explore | 70 | Highest attention for information gathering. Prime myth-busting opportunity. |
| Experience | 65 | Intent is no longer commercial, but attention is total. Source of future reviews. |
| Inspired | 55 | Vast reach, not yet ready to buy. Vital for shaping early perceptions. |
Millions of Data Points Across Disparate Sources
Reconstructing the dark funnel is not a spreadsheet exercise. It is an engineering problem.
We process over 3 million data points per engagement, drawn from sources that were never designed to work together.
Semrush Trends API provides search volume, market share, and competitive intelligence across traditional search. GWI delivers global audience behaviour data, including platform preferences and content consumption patterns. Roy Morgan Helix adds Australian-specific psychographic profiling. Apify scrapers extract unstructured data from social platforms, review sites, forums, and community discussions. And our custom Python pipelines run NLP clustering, entity extraction, and sentiment analysis to make sense of millions of unstructured data points.
The entire pipeline is automated, but the strategic interpretation requires human expertise. This is where the 300+ hours of development come in. We built the infrastructure so the analysis can focus on what matters: understanding where your audience discovers you and what influences their decisions.
Different Customers, Different Journeys
One of the most valuable outputs of applying the MPI framework across personas is how clearly it reveals that a single content and channel strategy cannot serve all customer segments simultaneously.
Take three cruise audience segments:
Example 1
New to Cruise Couples like the Smiths begin their discovery journey on TikTok and Instagram, move to ChatGPT for itinerary and inclusion comparisons, validate through reviews that counter stereotypes about cruising, book via mobile with flexible offer prompts, and share through Instagram and TikTok live posts and peer review content. The AI tools are deeply embedded in their comparison and validation stages.
Example 2
Families with Children like the Clarkes have a completely different trigger; often, the kids themselves prompt the holiday conversation. They search for family-friendly cabins, validate through Facebook parent groups and blogs, respond to price promotions at booking, and share through family Facebook albums and detailed reviews of child facilities.
Example 3
Mature Explorers like Helen and Bob are destination-driven from the outset. Their research is deeper and longer. They validate through trusted media, awards, and established reviews rather than social proof. They often book via a travel agent or a direct call. And their sharing happens through detailed peer influence reviews on platforms that carry weight with their demographic.
Mapping these journeys against the MPI framework shows precisely where each segment needs different content, different channels, and different measurement approaches — and where the opportunities that competitors are missing actually sit.
The Activation Blueprint: From Channel-First to Moment-First
The Moment Map tells you where attention lives. The Activation Blueprint tells you what to do about it.
Traditional media plans are channel-first: “We will spend X on paid search, Y on social, Z on display.” The Activation Blueprint is moment-first: “At this stage of the journey, the customer’s mindset is X, they are on platforms Y and Z, and the measurement approach is W.”
For each journey stage, the Blueprint defines:
The customer mindset at that moment. Are they browsing casually? Actively comparing options? Ready to commit?
The strategic response required. Should you be building awareness, providing comparison content, or removing friction from the conversion path?
The specific discovery channels where that moment happens. A “Validate” moment might happen on Reddit, TripAdvisor, and Google Reviews. A “Discover” moment might happen on TikTok, YouTube, and Instagram.
The activation tactics for each channel. What content format works? What triggers engagement?
The measurement approach for each surface. For traditional search, you measure organic CTR and position. For AI platforms, you measure Share of Model Voice. For social, you measure brand lift and share of conversation.
This ensures you secure visibility at the point of belief, not just the point of click.
AI Share of Voice and Agentic Readiness
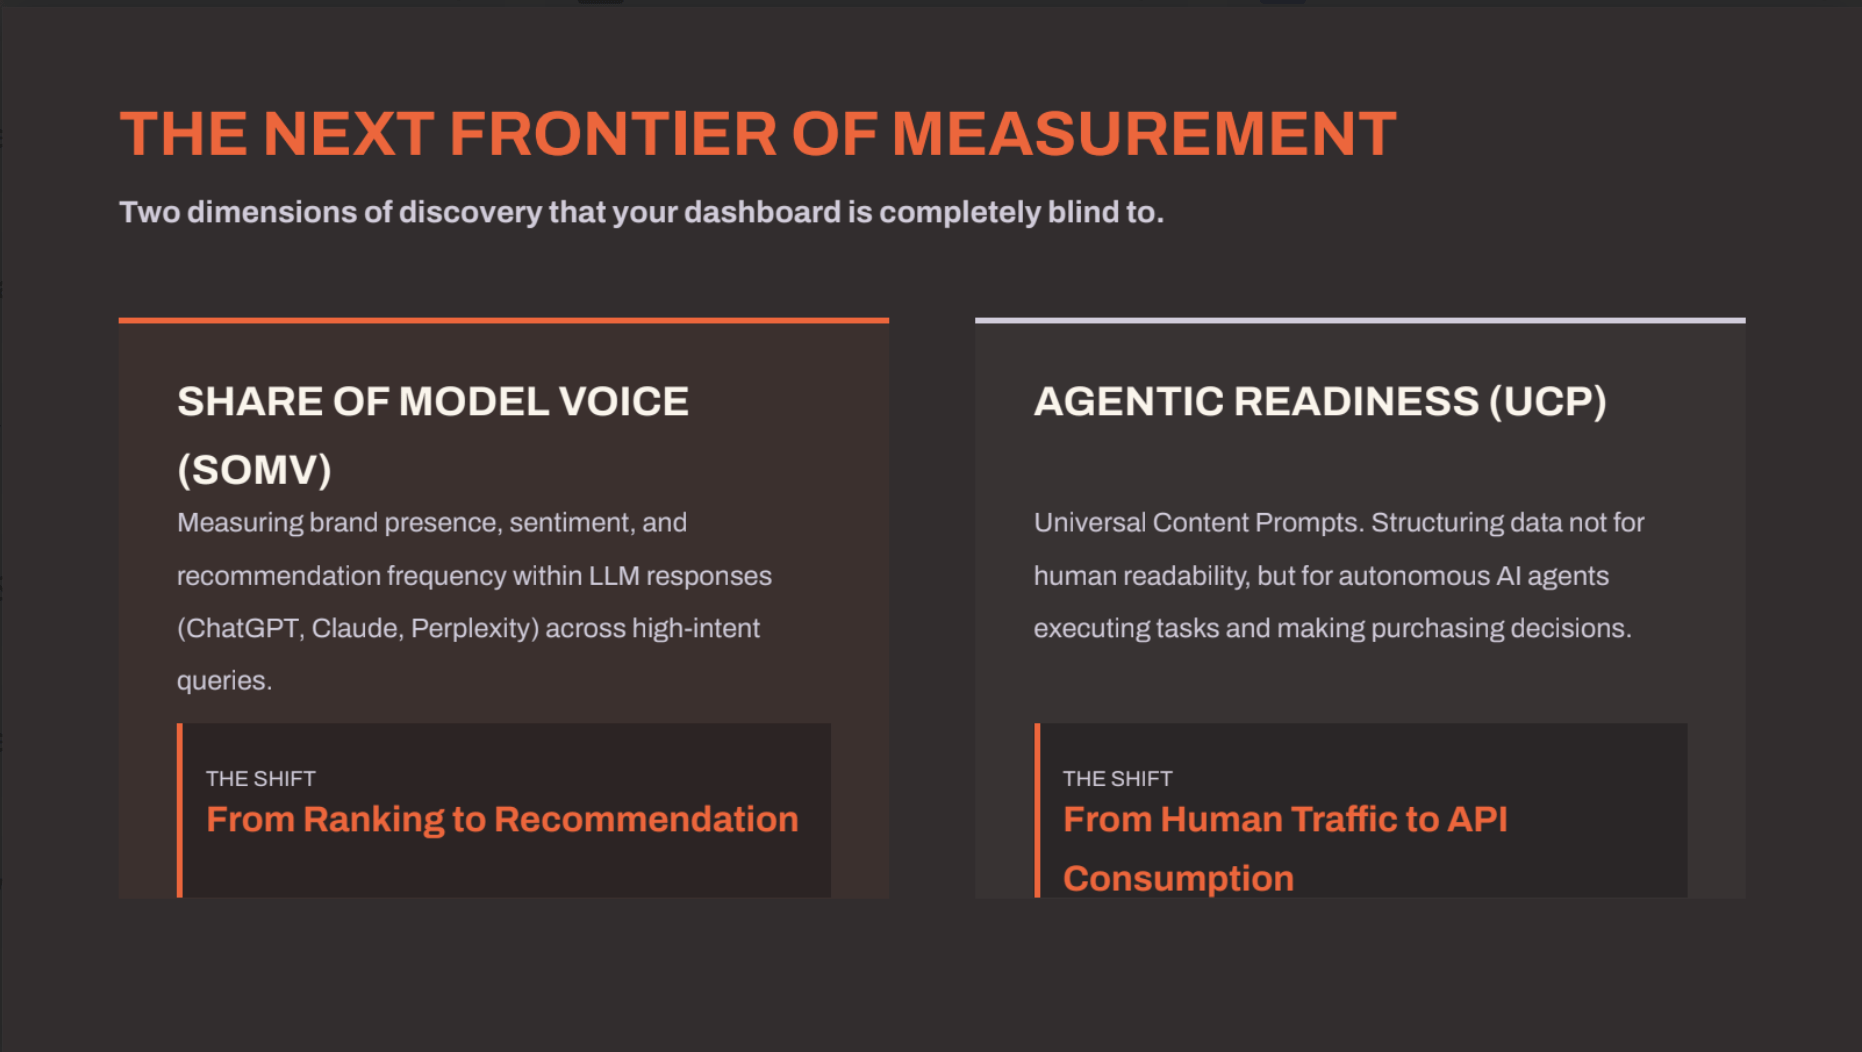
Two emerging measurement dimensions that almost no one is tracking yet.
Share of Model Voice (SoMV) measures your brand’s presence, sentiment, and recommendation frequency inside large language model outputs. When someone asks ChatGPT “What is the best analytics consultancy in Australia?” or “Which CRM should I use for a mid-market B2B company?”, does your brand appear? How often? In what context? With what sentiment?
SoMV requires a three-layer prompt architecture: Voice of Customer prompts (how real users phrase their questions), Search Channel prompts (testing across ChatGPT, Gemini, Perplexity, and Claude), and Funnel Segmentation prompts (testing at different stages of the decision journey). We have built monitoring for this, and the results are often surprising. Brands that dominate traditional search rankings can be completely absent from LLM recommendations, and vice versa.
Agentic readiness is the next frontier. As AI agents begin making purchasing decisions on behalf of users, particularly in B2B procurement and high-consideration consumer categories, your product data needs to be structured in a way that agents can parse and act on. The emerging standard is the Universal Commerce Protocol (UCP), an open-source specification that uses a /.well-known/ucp manifest to make product information machine-readable.
Research suggests 15% to 25% of all digital e-commerce and B2B procurement could be handled by autonomous AI agents by 2030. If your product catalogue is not agent-readable, you will be invisible to this growing segment of commerce.
Brand Experience Optimisation (BX) ties these dimensions together. BX is the sum of Branding, Customer Experience (CX), and Product Marketing. AI engines do not just surface products. They recommend them. Poor CX, bad online reputation, or weak product marketing can cause an AI to deprioritise or exclude your brand from its recommendations, even if you rank well in traditional search. Your brand’s experience across every touchpoint now directly influences whether AI systems choose to recommend you.
The Source of Truth Gap
Here is the exercise we recommend to every analytics leader we work with.
Do not start with your analytics. Start with your source of truth: your ERP, your CRM, your PMS, your accounting system. Look at your total revenue.
Now work backwards.
Total revenue in your ERP: 100%. This is the number your CFO trusts. It is real, verified, and reconciled.
Revenue matched to a marketing touchpoint in your CRM: typically 40–60%. Already, 40% to 60% of your revenue has no marketing attribution at all.
Revenue your analytics platform can attribute to a specific channel: typically 25–40%. Your GA4 or Adobe instance can explain less than half of what your CRM already struggles to attribute.
Revenue you can trace to a specific campaign or keyword: typically 10–20%. The granular, campaign-level attribution that most marketing teams optimise against represents a tiny fraction of total business value.
The gap between your source of truth and what your analytics can explain is your measurement blackout. It is your dark funnel.
HubSpot’s 2026 research found that 68% of marketers struggle to attribute revenue accurately. Only 41% can confidently tie marketing spend to revenue outcomes.
If you only optimise for the 10% to 20% you can see perfectly, you are starving the engine that drives the rest.
From Measurement Blackout to Omnichannel Answer Ownership
The most dangerous analytics dashboard is not the one that is empty. It is the one that looks complete but is actually a work of fiction.
We need to stop optimising the data we can see and start building frameworks for the reality we cannot.
Eric Stine’s question cuts to the heart of it: “Do you know what question you are the answer to? Do you know what questions you need to be the answer to?“
In 2026, performance is about Omnichannel Answer Ownership. It is about ensuring your brand is the definitive answer, regardless of where the question is asked or how the answer is delivered. Whether that answer comes from a Google AI Overview, a Reddit thread, a ChatGPT prompt, a TikTok search, or an autonomous AI agent making a purchase decision.
This requires a structural shift in how we think about measurement. Away from click-based attribution and toward presence-based measurement. Away from channel-first planning and toward moment-first strategy. Away from traffic volume as the primary KPI and toward answer ownership across every surface where your audience makes decisions.
The tools exist to build this. The data sources exist. The analytical methods exist. What is missing, for most organisations, is the recognition that the old model is broken and the willingness to invest in building something better.
Monday Morning Actions
If you have read this far, you are probably wondering where to begin. Here are four concrete steps you can take this week.
1. Quantify your gap. Pull your total revenue from your ERP. Match it against your CRM’s marketing attribution. Then compare to your analytics platform’s channel attribution. The difference is the size of your measurement blackout. This is your business case.
2. Audit your “Direct” traffic. Segment your Direct channel by landing page, device type, time of day, and geography. Look for patterns that suggest the traffic is not actually direct. High-value landing pages with disproportionate “Direct” traffic are a strong signal of stripped attribution.
3. Measure your AI visibility. Start monitoring how your brand appears in LLM responses for your top 20 category queries. You can do this manually with ChatGPT, Gemini, and Perplexity, or build automated monitoring. The results will likely surprise you.
4. Choose your analytics architecture deliberately. If you are on GA4 Free, understand what you are giving up in terms of data ownership, raw data access, and modelling transparency. Evaluate whether GA360 or Matomo would give you a stronger foundation for the measurement challenges ahead, particularly in light of Australian privacy regulations.
Run a Pilot With Us
Explore how Discovery360 can map your dark funnel and build a measurement framework grounded in your customers’ actual discovery behaviour.