A lot of us in the industry remember the last Google Analytics code & tracking transition in 2012 — from ga.js to analytics.js, and it’s that time again.
There are some pretty big implications in the move to GA4 for the roughly 56% of the Internet that uses Google Analytics. Namely, the way things are measured. It’s all event-based, there are no “sessions,” not in the technical sense.
This kind of event-based tracking has been around for a while in analytics systems like Heap, Mixpanel and Amplitude. Until this move by Google Analytics, though, it’s been mostly a secondary form of analysis and a bit of a fringe implementation for the early adopters or the ones with cash to burn.
With Google Analytics moving to event-based tracking, it’s a forced migration for many who don’t understand the theory, the language or the way to get the best out of an event-based system. I can’t really say I understand it yet to its fullest capability, either. Plus, I’m older now. I don’t like change as much as I used to.
Learning curve and team training? Is the team struggling with the new report? Where do they get stuck compared to UA?
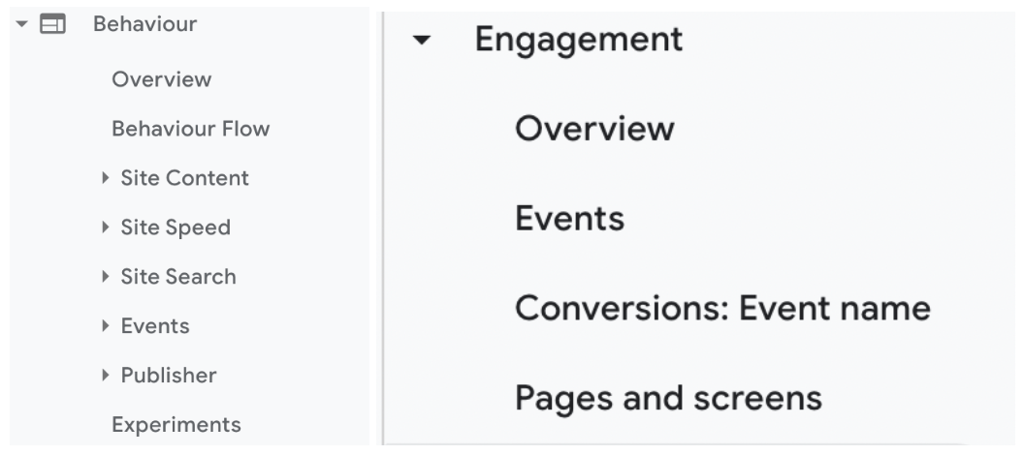
One of the biggest things my team is getting used to — or perhaps “getting to grips with” is a better phrase for it — is the lack of out-of-the-box granularity in the standard reports. Just look at the difference between UA (left) and GA4 (right) and the on-site behaviour reporting that comes standard:
It’s clear Google is expecting (or forcing) the events reporting to do a lot of the heavy lifting to replace a lot of the more specific sub-reports in UA/GA3:
- Site search is sent as an event
- Site speed isn’t actively tracked within Google Analytics
- The site content report got rolled into “Pages and screens,” and again, isn’t as robust
So what my team is running into is what feels like a lack of clear data. Some of our touchpoints are lost, too. Page value is no longer an out-of-the-box metric. A few specific things we’re running up against include:
- Using “comparisons” rather than “segments” takes a bit for the brain to get used to. In some ways, it’s more flexible, in other ways, less.
- Generally getting used to the concept of “events.” It has a higher barrier to entry and is less accessible for those not as technically-minded to grasp.
- Nobody is still really using “Explore” to its greatest potential because we don’t really have the time for the learning curve. We typically use it to regenerate the reports we’ve lost with GA4.
- Unique events don’t exist. The closest that does is “Total Users”, which is defined as “The total number of unique users who triggered at least one event.” So for anyone who relied on real-time event reporting to debug event tracking, you’ll probably have to find another way. Hit-based data you want to collect would need to be done as an event-scoped custom dimension (which you only have 50 of).
- Small but not: Save and export aren’t available for standard reports or report configurations.
A lot of SEO’s out there are saying what they’re finding they need to do in order to really take advantage of GA4 and the event-based set up (which, yes, honestly, can be really rich data) is pulling everything into Big Query and working it from there. My team (and a lot of SEO teams) don’t know SQL. So that’s a new thing to learn, yay.
Jack and Mark of Candour had an interesting discussion at the end of March 2022 about some of the choices Google is making with GA4: IP anonymisation is automatic, you can only keep your data on the platform for 14 months, and there’s no data migration options, it’s a clean slate. Their bet is basically Google needs to dump this liability of data they’re sitting on with different privacy regs from the last decade or so, and start fresh with more regimented privacy controls. So it’s all just going buh-bye. Blow it up and walk away, like all the heroes do in action movies.
There are also a few changes in the admin of the properties that are definitely leaning more towards an enterprise or large company setup — a company that has the ability to have dedicated analytics and BA teams: the “free” link to BigQuery, the reliance on events, the lack of views (which many of us use to test out filters and to also keep a “clean” record of data). These changes also lead me to a conclusion I’ll talk about a bit more later, but let’s say it’s in the best interest of Google’s bottom line.
What metrics do we look at? How is the reporting changing?
Some of the changes Google have made (that we haven’t already discussed) that may affect your day-to-day as an SEO include:
- All the points mentioned earlier: segments, explore reporting, unique events, exportation, loss of site speed reporting and sharing.
- Bounce rate has been replaced with “engagement rate.”
- Rather than focusing on the negative (people leaving), Google is shifting the focus to the positive (people interacting).
- While I’ve yet to explore, this might impact bot traffic identification.
- Default channel groupings: In GA4, you can’t create your own, nor can you edit the default channel grouping. Both of those were options in UA.
- Content groupings would need to be recreated as a custom event.
- The ability to filter has been limited to a set number of cases: cross-domain tracking, internal IP exclusion, referral white-listing, and session timeout adjustment.
- Things like case and parameter management would need to be declared elsewhere.
- Sessions are calculated differently — there are fewer ways to start a new session in GA4 than UA.
- Subproperties, a similar concept to views, seem to be currently limited to GA360 clients.
In this case, Google is essentially shifting us to work within the “Explore” section — the standard reports in the “Reports” section of GA4 feels like a Google Data Studio dashboard you don’t have edit permissions for: once you get lower than the first level of data, you lose the ability to build on that granularity with secondary dimensions or filters.
So I could go to the Events “homepage” report and add a secondary dimension (e.g. device, Default Channel Grouping, session landing page) and “comparison” (e.g. Organic traffic), but then I click on an individual event type and expect to be able to include that secondary dimension again in my next report screen — and find I can’t. All I get is a summary of data related to that event: event count, realtime tracking, events by country, gender, page title, location and referrer.
To get that level of detail you’d need to replicate that report in the “Explore” section.
So all at once, GA4 is becoming more powerful and less helpful. The data is much more what you make of it; Google isn’t holding your hand. And let’s be honest, for time-poor agency and enterprise teams, that hand-holding in previous generations of Google Analytics was definitely useful, sometimes critical.
This “more powerful, less helpful” headspace seems to be coming through in what events are included by default in Google Analytics 4: it feels like there are fewer of them. You already know how I feel about the loss of page value. What it ends up at though is this: before you get into the weeds with the data, you need to have a wider business conversation about what metrics you’re measuring.
Let’s be honest, most businesses are not great at having conversations around measurement protocol, or understanding what actually accurately represents measurement of a particular target. How would you measure customer satisfaction? How would you measure brand loyalty? What actions impact whether a returning customer buys a new product from you: the article they read, the call-to-action they clicked on, the personalised landing page they came through on?
Everyone has a different approach. Engineers want to be practical. Sales are focused on revenue. Marketing is focused on acquisition. Customer service is focused on retention. And unless you have a data architect in the conversation with strong stakeholder management skills who also has a solid grasp of the long-term business strategy, conversations around “what do we measure” easily become a political minefield that sets the business back a decade, or shut their doors entirely, if you choose the wrong metrics to measure and drive performance on. Just ask Wells Fargo.
So while narrowing down the custom metrics you include in your Google Analytics 4 report to 50 seems doable, it very well may not be. Just think about:
- The number of unique CTAs you have.
- The number of unique-to-you fields you want to analyse in your conversion funnel (think: credit check, booleans on PII, granularity on what individual field they got to before dropping).
- The number of clickable components on the site that could be a part of a conversion journey.
- The logged-in customer journey & touchpoints.
All too easy now to see how easily 50 custom dimensions can become too few, right?
How will low maturity brands that report on last-non direct clicks be affected by the data-driven attribution modelling?
Low-maturity brands can still travel along their flywheel to build understanding and visibility and buy-in for a more data-driven attribution model. Last non-direct click attribution still exists in GA4, it’s just not the recommended attribution model. At this point, it’s an opt-out for the data-driven attribution model.
This is one function I’m excited the team at Google Analytics has evolved — rather than having attribution modelling ring-fenced within a single set of reports, the choice of attribution modelling can now be set at a property level.
Having both property level attribution modelling and individual reports where you can change the attribution model (model comparison and conversion path reports) opens up the conversation if you’re in a less mature brand.
It allows you to set up the property with the attribution model they know and love (and you probably hate) and walk your stakeholders through what different attribution models look like. More than that, what the why behind them is, and why something like a data-driven attribution model is probably more accurate.
An easy exercise would be to ask them about the last time they bought something new-to-them on the Internet. How did they make the purchase? Did they go straight to the site they were going to buy from? Or did they see someone mention something on Whirlpool, look at that brand website, go back to Product Review or another comparison site, read a few articles, hop around to a few competitors and then land on one after they saw a retargeted display ad on their favourite news outlet? It’s rarely a linear journey to conversion. Having a model that only reflects the value of the last non-direct source is underestimating the impact of most channels on building a relationship with a customer.
This broader ability to control attribution within Google Analytics 4 allows you to have that conversation and easily shift to a data-driven attribution model once the buy-in is there.
What battles are fought on custom attribution inside large organisations?
Intrinsically, who builds the custom attribution model is where the fight is, right? Historically, we’re biased to last-click because it’s what large-scale Analytics platforms are able to generate en masse because of the computing power required otherwise.
So if marketing holds the keys to the custom attribution modelling that already exists, you may have to tread carefully when talking about moving away from last-click attribution, as it would definitely affect their internal reputation with a change in how many conversions are attributed to the paid media they likely control. Framing it as a benefit to their ability to more efficiently spend and capture new audiences at different levels of the funnel would probably be a smart approach or at least one to consider.
That being said, I think for a lot of large organisations the battles are more time-based than they are department-based. People have KPIs based on hitting certain metrics, and if the measurement of that metric changes in the middle of their financial year, or suddenly the primarily last-click channel is getting less “credit” for a conversion, people will be up in arms. It affects their bottom line, their performance rating and probably their bonus or even their commission.
Timing of this roll-out internally will be critical — if the hard cutover can line up with your financial year, that’d be ideal.
How will data-driven attribution models influence SEO strategies?
Hopefully for the better! Between data-driven attribution models, conversion paths and a sneaky custom event for page value (for me at least), as an industry we should be more informed about what in our customer journeys actually impacts their behaviour, and optimise to that.
We may actually find out for sure that whitepaper is making a difference, or that long-form content is building our thought leadership. It should also give us the ability to target the gaps in our journeys as well, by reviewing where in the conversion journeys other channels are doing a disproportionate amount of work when compared to the channel split.
More data-driven attribution will really show our stakeholders something we all know and sometimes have trouble articulating: organic matters, and impacts every step of the customer journey.
How do we prepare for a change of conversation?
We gird our loins for battle. Honestly, it’s probably going to be a mostly good conversation. It’ll be challenging — any process that forces you to sit down and really examine what is important to your business and how you measure it is tough, often because you realise how far you’ve strayed from your original intentions.
This process will be a bit of a reckoning for most companies, but once the measurement protocol is set and things are humming, I think the industry will be in a better space. Preparation is key, though, and for the SEO industry and Google Analytics 4, a lot of that comes down to front-loading the time-intensive work to prepare the data that GA4 now requires to get similar data granularity to what’s previously been out-of-the-box. That means:
- Creating business cases for custom metrics to include in the measurement protocol, including why they’ll benefit more than SEO.
- Introducing or supporting a data warehousing plan — Google Analytics 4 only stores your data for 14 months.
- Build a buffer into your future budgets for a shared cost of Analytics (if you don’t already use GA360): the lack of detail in standard reports, the switch to more analyst-technical naming conventions, the further aggregation of historical data, the push to Big Query for analysis — to me, this all points to at some point in the future all Google Analytics products being paid. Or a situation where if you want to be able to get any real worthwhile data, you have to pay.
- If you can, get UA and GA4 running in parallel, with a data-driven attribution model on GA4.
- Use this to see the gap between organic impact (it’s hopefully positive).
- Build business cases around how you’re seeing organic impact higher in the funnel and what screens are in your customer journeys to conversion.
- Getting really familiar with the Explore interface, and setting up the key explorations you need to report within your business (at least). Baseline expectation would be revenue from primary conversion(s) driven by organic sessions.
- Starting to learn BigQuery.
While it may be tempting to fight the migration to GA4 (believe me, I definitely have), the earlier you adopt, learn and embrace the new platform, the more you’ll be able to leverage it to advocate for SEO and the needs and wants of your team. Now it’s time to take my own advice.

