Ready to set up annotations now that you’ve migrated to Google Analytics 4? Learn about setting up GA4 annotations, learn whether you can migrate them across and get our top solution.
Can you migrate annotations to GA4?
We have had multiple emails and questions about how to migrate annotations to GA4 over the last few months since the looming GA4 deadline. Unfortunately, there’s no way for you to migrate annotations to GA4. But we’ll be sharing a practical solution for GA4 annotations below if you feel you need to migrate your old annotations over manually.
Can you add annotations in GA4?
Can you add annotations in GA4? The short answer is no. At least, not like you once did in Universal Analytics. However, if you’re seriously missing this feature, we’ll show you how to add annotations in Looker Studio.
GA4 annotations solution
How to add annotations in Looker Studio
This is your best bet if you want a visual clue of key dates and annotations. Create a Looker Studio dashboard that connects to your GA4 data. Looker Studio allows you to add text boxes, shapes, and other elements to create visual annotations on top of your data visualisations. While this approach involves a separate tool, it can offer a way to visually mark important events on your GA4 reports.
Create a Google Sheet for your annotations
First, you’ll want to create a Google Sheet where you can jot down the annotations you want to add to your GA4 data.
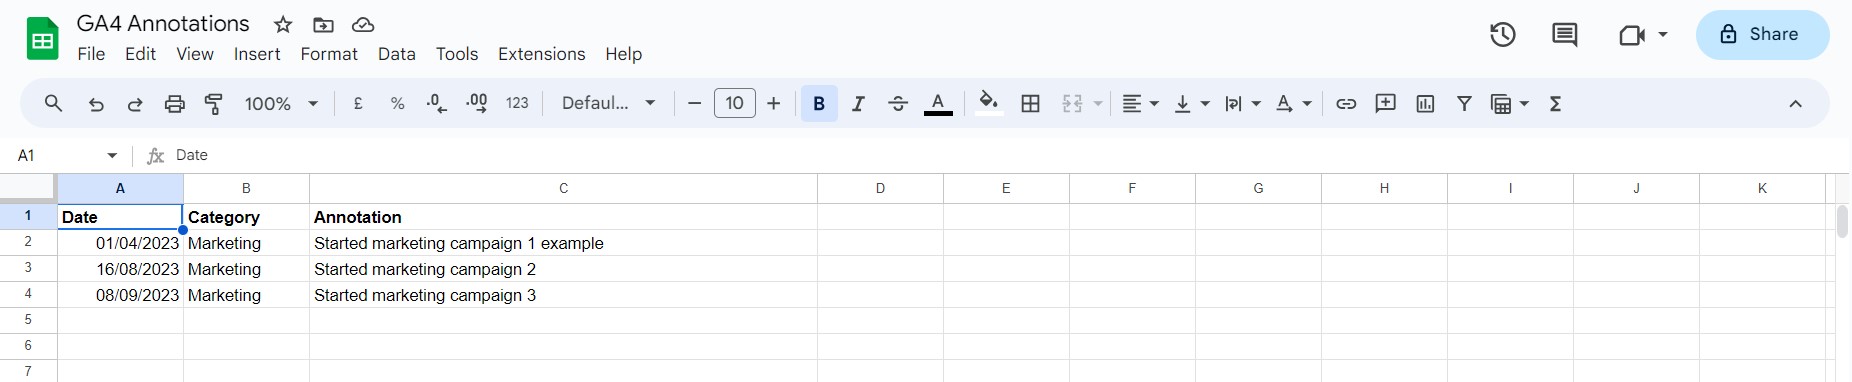
- Create a new Google Spreadsheet and give it a name such as ‘GA4 annotations’
- In column A, add the date (ensure the date settings in your spreadsheet are correct first)
- In column B, let’s add a category for the annotations, for example, ‘Marketing’
- In column C, we can manually add the annotation
Make sure your spreadsheet looks something like this:
Connect annotations in Looker Studio
Now that you have your annotations spreadsheet setup we need to connect it to Looker Studio.
- In Looker Studio, click ‘create’ and select ‘data source’
- Select ‘Google Sheets’ as the connector and authorise
- Now select your annotations sheet and make sure ‘Use first row as headers’ is selected
- Click connect
Create a report in Looker Studio
- Click ‘Create’
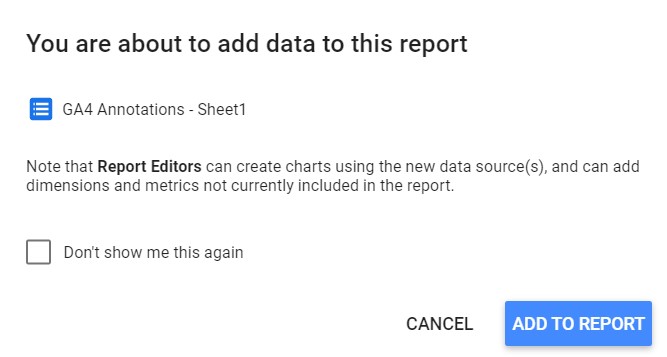
- Add your new dataset to the report
- Now click on ‘Resource’ again and ‘Manage blends’
- Click ‘Add a blend’
- For the first table, change it to your Google Analytics 4 data source
- Add ‘Date’ as the dimension
- Now add ‘Total Users’ as the metric
- Name the table something like ‘GA4 users’
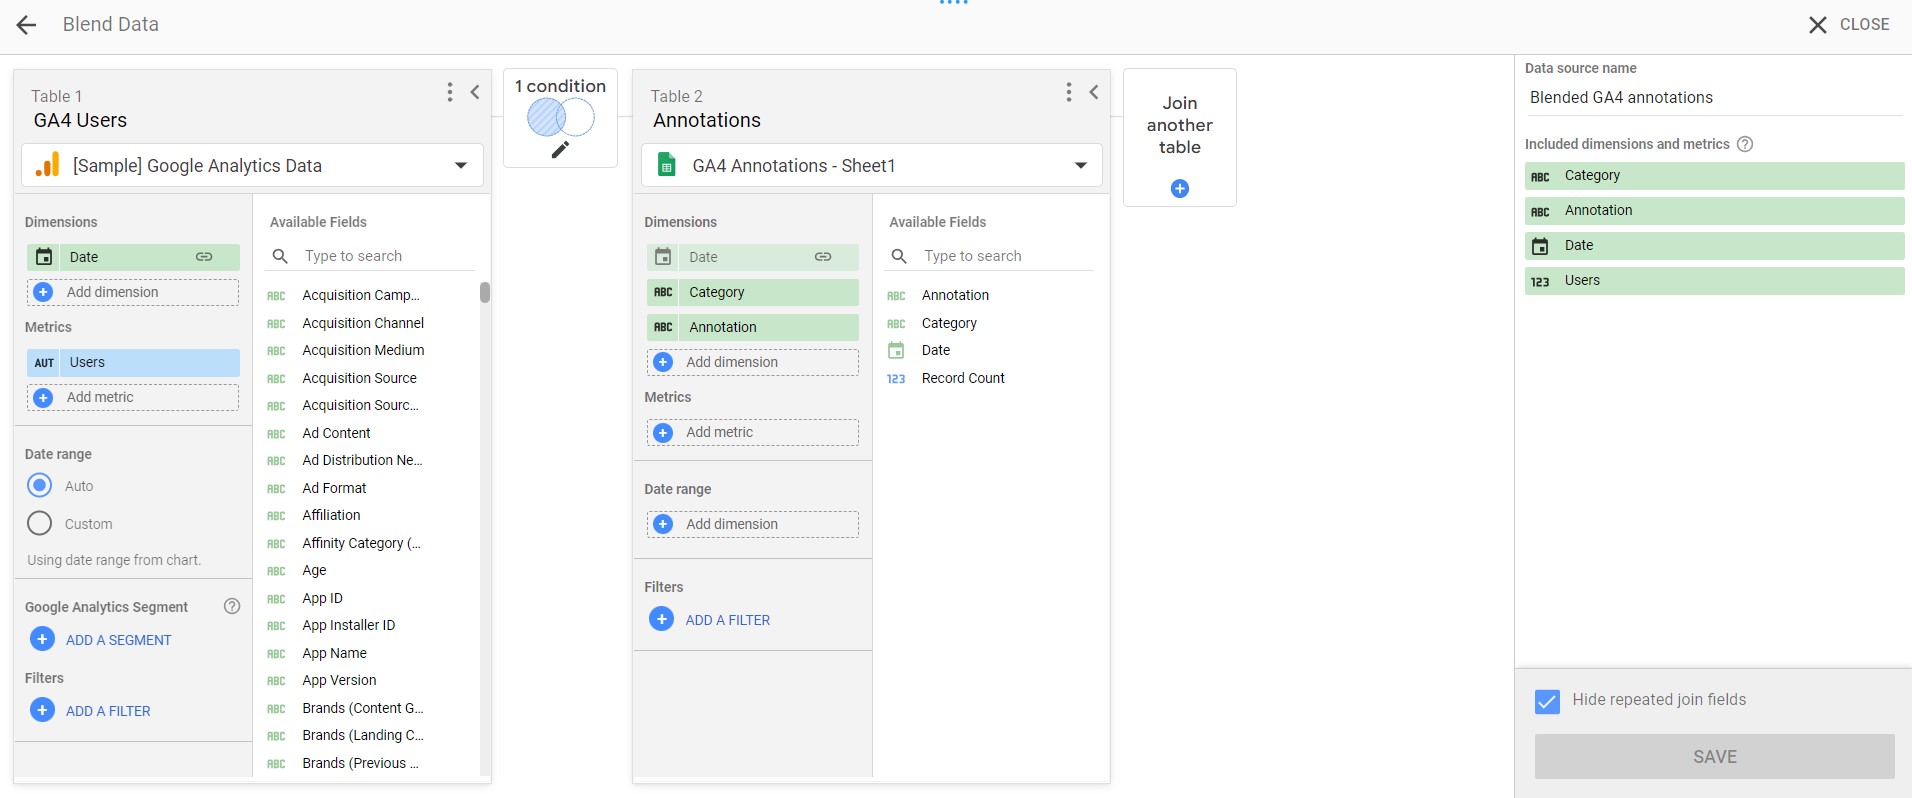
- Now let’s join another table to our blend, select the Google Sheet of annotations
- Add date, category and annotations as dimensions
- Name the table ‘Annotations’
- Click ‘Configure join’ in the middle of your tables
- Select ‘left outer’ and keep ‘Date’ as the join conditions
- Click Save
- Name the new blended data something like ‘Blended GA4 Annotations’
- Click Save
Create a Time Series Chart
In your report, you’ll want to create a time series chart to display your annotations on top of your data from GA4.
- Click ‘Insert’ and add a ‘Time series chart’
- Now let’s change the data for the chart and select your blended data source
- For Dimensions select ‘Date’
- For Metrics let’s add ‘Total Users’ and ‘Category’
- Select the Style tab
- Change ‘series no 2.’ to ‘bars’
- Select ‘Right’ as the axis
- Scroll down and find ‘Right Y Axis’, set the minimum to 0, the maximum to 1 and the custom hatch mark interval to 1
- Click back to the ‘Setup’ tab
- Hover over the ‘Category’ metric and select the pencil icon
- Change the name to ‘Annotation’
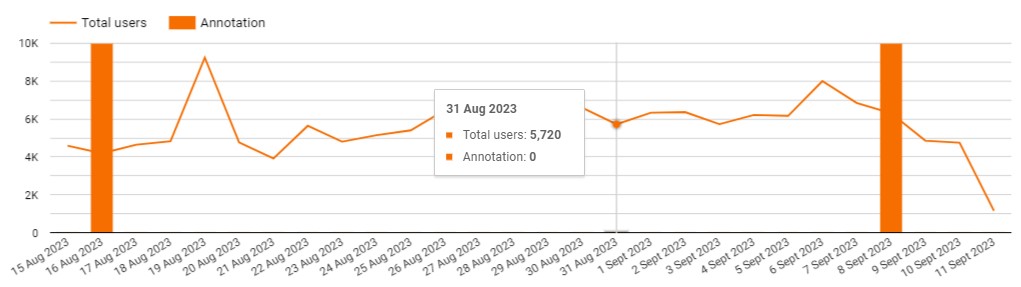
Now you can clearly see when you set annotations over your GA4 user data.
Create a Table
Now, let’s create a table so we can clearly see the annotations underneath our time series chart.
- Add a ‘Table’ directly underneath your time series chart
- Add ‘Category’ and ‘Annotations’ as Dimensions, as well as ‘Date’
- Change the Sort from ‘Descending’ to ‘Ascending’
- Now we want to filter out all the dates that don’t have annotations, click ‘Add a filter’ and name the filter something like ‘remove null’
- Change to ‘Exclude’, select ‘Annotation’ and select ‘Is null’
- Click Save
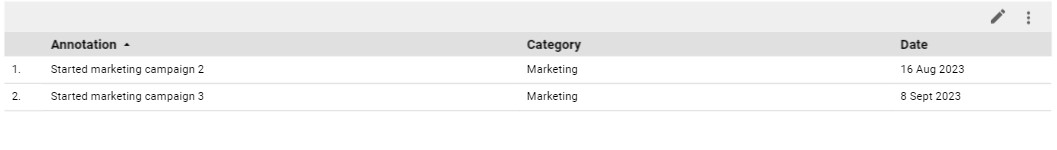
Now you should have a table that looks something like this.
View Your Report
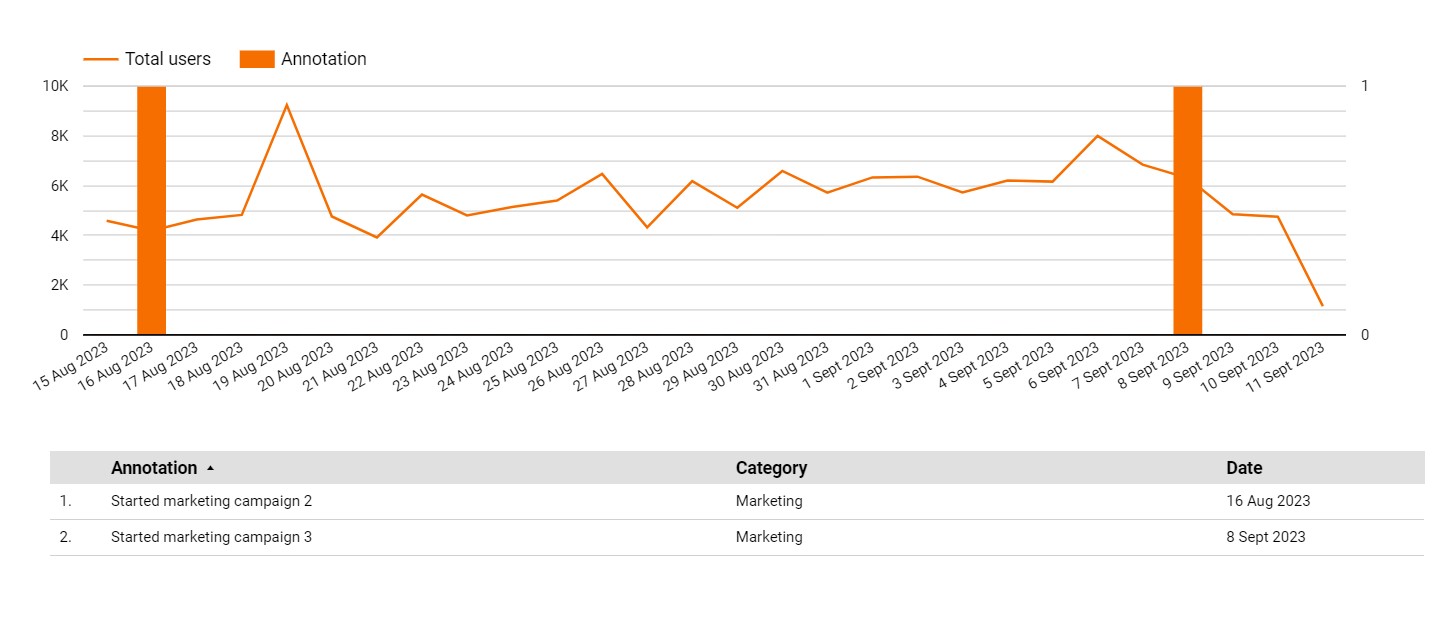
Now you can view your annotations report in Looker Studio!
Click on ‘View’ to view your report. You can select an annotation either in the time series chart or the bar chart to view the corresponding annotation.
Need some help?
If you need help setting up a way to track annotations or creating a Looker Studio dashboard we can help. We make data look pretty. Pretty interesting, that is. We present data in a visually compelling and digestible form to help your stakeholders make data-driven decisions. Talk to us today.